
Discover the complete Beer SRM color chart and visual guide. Learn how Standard Reference Method (SRM) values influence beer appearance, flavor profiles, and brewing techniques. Includes common beer styles by color and expert brewing insights.
Have you ever wondered why your favorite porter looks so dramatically different from that crisp pilsner, or why some IPAs appear golden while others have a deep amber hue? The answer lies in the Standard Reference Method (SRM) – the beer industry’s definitive scale for measuring and communicating beer color. Whether you’re a homebrewer perfecting your latest recipe, a craft beer enthusiast expanding your knowledge, or simply curious about what gives beer its visual identity, understanding SRM is your gateway to appreciating one of beer’s most distinctive characteristics.
What is SRM in Beer?
SRM, or Standard Reference Method, is the modern measurement system used in North America to quantify beer color. Developed by the American Society of Brewing Chemists (ASBC) in the 1950s, SRM provides brewers and consumers with a standardized way to describe beer appearance using numerical values.
According to the Brewers Association, SRM values typically range from 2 (pale straw) to 40+ (opaque black), with each increment representing a specific color intensity. Unlike subjective color descriptions, SRM gives us an objective, scientifically-backed way to classify beer based on its appearance.
But SRM is more than just a number – it represents the complex chemistry happening in your glass and offers insights into potential flavor profiles, brewing techniques, and historical traditions behind different beer styles.
The Science Behind Beer Color
Beer color primarily comes from malted barley – the soul of beer. During the malting process, barley undergoes controlled germination followed by kilning (heating). This kilning step is where color development begins.
Maillard Reactions: Nature’s Color Chemistry
The primary chemical process responsible for beer color is the Maillard reaction – the same phenomenon that browns your toast and gives seared steak its delicious crust. Named after French chemist Louis-Camille Maillard, these reactions occur when amino acids and reducing sugars interact under heat.
During malting and mashing, proteins in the barley break down into amino acids which then react with sugars to create melanoidins – complex compounds responsible for both color and flavor characteristics. According to research published in the Journal of the Institute of Brewing, these melanoidins not only contribute color but also antioxidant properties and flavor stability.
From Malt to Glass: The Color Journey
Beer color isn’t static – it evolves throughout the brewing process:
- Malt Selection: Base and specialty malts contribute different SRM values
- Mashing: Temperature and pH influence color development
- Boiling: Extended boil times intensify color through concentration
- Fermentation: Yeast can slightly alter final color
- Filtration: Can lighten beer by removing color-contributing particles
- Aging: Oxidation may darken beer over time
It’s worth noting that brewing water chemistry also plays a significant role in color development, with alkaline water generally producing darker worts during mashing.
The SRM Measurement Process
How exactly is SRM measured? The method is elegantly simple in concept but precise in execution:
- Beer is placed in a 1/2-inch (1.27cm) path length cuvette (a specialized container for spectrophotometry)
- Light at a wavelength of 430 nanometers (blue-violet region) is passed through the sample
- The absorption of this light is measured and multiplied by 10 to produce the SRM value
For homebrewers without access to spectrophotometers, color comparisons against standardized charts or specialized beer color analyzers like the Hanna Instruments Beer Analyzer provide reasonable approximations.
Modern breweries increasingly use digital colorimeters designed specifically for brewing applications, ensuring batch-to-batch consistency.
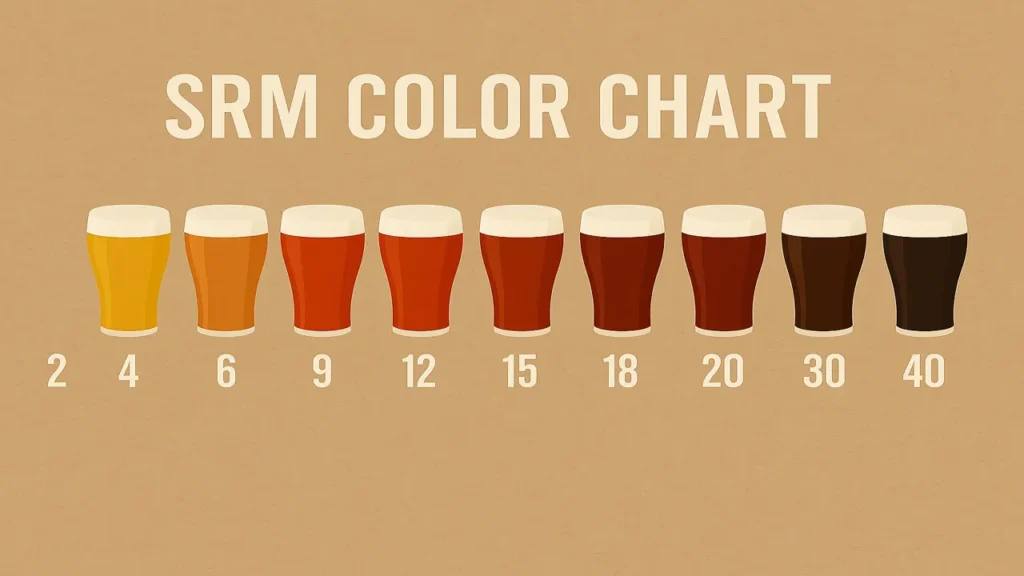
SRM Color Chart: A Visual Beer Rainbow
The SRM scale creates a beautiful spectrum of beer colors, each range associated with distinct beer styles and characteristics:
| SRM Value | Color Appearance | Common Beer Styles | Flavor Implications |
|---|---|---|---|
| 2-3 | Pale Straw | Light Lagers, Pilsners, Berliner Weisse | Clean, crisp, minimal malt character |
| 3-4 | Straw | Belgian Witbiers, Kölsch | Subtle malt sweetness, wheat character |
| 4-6 | Pale Gold | Blonde Ales, Hefeweizen | Light breadiness, mild sweetness |
| 6-8 | Gold | American Pale Ales, Saisons | Balanced malt presence, bread/biscuit notes |
| 8-12 | Amber | Märzen/Oktoberfest, Irish Red Ale | Caramel, toast, stronger malt presence |
| 12-16 | Copper | Amber Ales, Altbier | Rich maltiness, toffee, nuts |
| 16-20 | Deep Copper/Light Brown | Bock, Dunkelweizen, Dubbel | Dried fruit, chocolate, significant malt complexity |
| 20-25 | Brown | Brown Ales, Dark Mild | Roast, chocolate, coffee notes emerging |
| 25-30 | Dark Brown | Doppelbock, Belgian Dark Ale | Bold roasted character, dark chocolate |
| 30-40 | Very Dark Brown | Porters, Sweet Stout | Pronounced roast, coffee, dark chocolate |
| 40+ | Black | Imperial Stout, Black IPAs | Intense roast, burnt notes, bitter chocolate |
At Brew My Beer, we’ve found that understanding this color spectrum helps homebrewers predict how recipe modifications might affect both appearance and flavor profiles.
| SRM | Color | Description | Common Beer Styles |
|---|---|---|---|
| 2 | Pale Straw | Light Lager, Pilsner, Berliner Weisse | |
| 3 | Straw | Witbier, Belgian Blonde, Kölsch | |
| 4 | Pale Gold | Weissbier, American Blonde Ale | |
| 5 | Gold | Tripel, Strong Pale Ale, Saison | |
| 6 | Deep Gold | Belgian Pale Ale, American Wheat | |
| 7 | Light Amber | Maibock, California Common | |
| 8 | Amber | English Pale Ale, Märzen, Vienna Lager | |
| 9 | Medium Amber | American Pale Ale, Bière de Garde | |
| 10 | Copper | Irish Red Ale, Altbier | |
| 12 | Rich Copper | English IPA, Oktoberfest | |
| 14 | Reddish Copper | Dunkelweizen, English ESB | |
| 16 | Light Brown | German Bock, Belgian Dubbel | |
| 18 | Medium Brown | Dark Mild, Dunkel Lager | |
| 20 | Rich Brown | Old Ale, Scotch Ale | |
| 22 | Deep Brown | Wee Heavy, Belgian Dark Strong Ale | |
| 24 | Dark Brown | Doppelbock, Munich Dunkel | |
| 26 | Mahogany | Brown Porter, English Brown Ale | |
| 30 | Very Dark Brown | Robust Porter, Belgian Quadrupel | |
| 35 | Very Dark Brown/Black | Sweet Stout, Baltic Porter | |
| 40+ | Black | Oatmeal Stout, Imperial Stout, Russian Imperial Stout |
SRM Color Scale
About SRM (Standard Reference Method)
The Standard Reference Method (SRM) is the American Society of Brewing Chemists' (ASBC) method for color assessment in beer. SRM values are determined by measuring the attenuation of light at a wavelength of 430 nanometers through 1 cm of beer.
While color can give clues about a beer's flavor profile, remember that brewing techniques and ingredients bring endless variations. Many beers defy expectations by combining unexpected colors with surprising flavors.
SRM vs. Other Color Measurement Systems
SRM isn’t the only way to measure beer color. Other systems include:
Lovibond Scale (°L)
Developed in the 1860s by Joseph Williams Lovibond, this older system predates SRM but remains common in malt specifications. The Lovibond method originally used colored glass comparators to visually match beer samples.
For practical purposes, many brewers use this approximation: SRM ≈ 1.3 × °Lovibond
EBC (European Brewery Convention)
The European equivalent to SRM measures at the same wavelength (430nm) but uses a different path length and does not apply the multiplier of 10. The relationship between the scales is: EBC ≈ 1.97 × SRM
According to the European Brewery Convention, EBC values are typically higher than SRM for the same beer, with the darkest beers reaching values of 80+ on the EBC scale.
Color and Beer Styles: A Historical Perspective
Beer color has deep historical roots that reflect both technological limitations and local ingredients:
Light Beers: The Pilsner Revolution
Before the 19th century, most beers were relatively dark due to primitive malting techniques that couldn’t avoid scorching. The development of indirect kilning in the 1840s changed everything, enabling the creation of pale malts and subsequently the world’s first golden pilsner in 1842 Plzeň (now Czech Republic).
According to beer historian Martyn Cornell, this innovation represented one of brewing’s most significant technological breakthroughs, creating an entirely new category of light-colored beers that would eventually dominate global markets.
Dark Beers: From Necessity to Choice
Dark beers were originally the norm rather than the exception. Historical records analyzed by Randy Mosher in his comprehensive brewing texts suggest that heavily kilned malts were unavoidable before modern temperature-controlled malting.
Today’s dark beers – porters, stouts, and dunkels – represent continuing traditions that transformed historical limitations into deliberate flavor profiles celebrated for their complexity.
How Brewers Control Beer Color
For homebrewers looking to hit specific SRM targets, understanding color contribution becomes essential:
Specialty Malts: The Color Toolkit
Different malts contribute varying levels of color:
- Base Malts (Pilsner, Pale): 1.5-4 SRM
- Vienna, Munich Malts: 4-10 SRM
- Crystal/Caramel Malts: 20-120 SRM depending on variety
- Chocolate Malt: 350-450 SRM
- Roasted Barley, Black Patent: 500-600 SRM
Beyond malt selection, brewers control color through:
- Mash pH: Lower pH (5.2-5.4) generally produces lighter worts
- Boil Vigor: Stronger boils concentrate color compounds
- Hop Load: Minimal effect, but very high hopping rates can add slight green tint
- Filtration Choices: Clarification methods can remove some color compounds
The Brewer’s Friend color calculator provides a valuable tool for predicting final beer color based on grain bill composition.
SRM and Flavor Correlation: What to Expect
While exceptions exist, SRM often provides clues to flavor expectations:
Light Beers (2-8 SRM)
These beers typically showcase:
- Subtle malt character
- Crisper, cleaner finish
- More prominent hop or yeast character
- Higher carbonation perception
- Thinner perceived body
Mid-Range Beers (8-20 SRM)
Moving into amber territory brings:
- Increased malt complexity
- Caramel, toast, and bread crust flavors
- Moderate sweetness
- Fuller mouthfeel
- Balanced hop expression
Dark Beers (20+ SRM)
The darkest offerings typically deliver:
- Roasted character (coffee, chocolate)
- Potential slight astringency
- Perceived fullness and richness
- Complex malt layers
- Subdued hop bitterness perception
Research published in the Master Brewers Association Technical Quarterly suggests these correlations aren’t merely coincidental – many of the same compounds responsible for color also contribute directly to flavor characteristics.
Common SRM Myths and Misconceptions
Several misconceptions persist about beer color:
Myth #1: Dark Beers Are Stronger
Perhaps the most common myth is that darker color indicates higher alcohol content. In reality, beer color and alcohol content have no direct relationship. Guinness Draught (4.2% ABV) is darker than many Imperial IPAs (8-10% ABV).
Myth #2: Dark Beers Are “Heavier”
While darker beers may have fuller flavor profiles, actual caloric content and body are determined by residual sugars and alcohol – not color. Many dark beers are surprisingly light-bodied.
Myth #3: SRM Perfectly Predicts Flavor
While trends exist, exceptions abound. Black IPAs demonstrate this perfectly – they feature the roasted appearance of a stout but hop-forward flavors more typical of much lighter beers.
According to Charlie Bamforth, brewing scientist and author, “Color may provide clues to flavor, but it’s merely one chapter in the complex story of beer.”
Using the SRM Chart in Homebrewing
For practical homebrewing applications, the SRM chart becomes a valuable planning tool:
Recipe Formulation
When designing recipes, consider:
- Style Guidelines: Reference BJCP style guidelines for appropriate SRM ranges
- Recipe Software: Utilize programs that calculate expected SRM
- Malt Selection: Choose specialty malts strategically, understanding small amounts of dark malts dramatically impact color
Quality Control
For established recipes, SRM helps ensure consistency:
- Batch Comparison: Track color across batches to spot process variations
- Process Evaluation: Unexpected color changes may indicate mashing or fermentation issues
- Aging Assessment: Color darkening over time may suggest oxidation problems
Competition Preparation
When brewing for competitions, color alignment with style expectations becomes crucial:
- Visual First Impressions: Judges evaluate appearance before tasting
- Style Accuracy: Meeting SRM guidelines demonstrates brewing precision
- Expectations Management: Color sets flavor expectations that influence overall evaluation
The Future of Beer Color Measurement
Beer color science continues to evolve:
Digital Analysis
Modern spectrophotometry and digital image analysis are replacing subjective evaluations. Apps like BeerColor allow brewers to estimate SRM using smartphone cameras, though with variable accuracy.
Beyond Single-Number Measurements
Some brewing scientists argue that single-wavelength measurements fail to capture the complexity of beer color. Tristimulus measurements (using the Lab* color space) provide more comprehensive color data, measuring not just darkness but also red/green and yellow/blue components.
According to research from Oregon State University’s brewing program, these advanced measurements better reflect human visual perception and may eventually supplement or replace SRM.
Color as Part of Beer’s Identity
The SRM chart gives us more than just a measurement – it provides a window into beer’s history, chemistry, and craftsmanship. From the pale gold of a Czech pilsner to the midnight depths of an imperial stout, color enriches our experience, setting expectations and connecting us to brewing traditions centuries old.
For homebrewers, understanding SRM empowers better recipe design and process control. For enthusiasts, it deepens appreciation of the visual art in every glass. And for everyone who enjoys beer, it adds another dimension to one of the world’s oldest and most beloved beverages.
Next time you raise a glass, take a moment to appreciate not just how your beer tastes, but how its color tells a story of ingredients, process, and brewing heritage. After all, we drink with our eyes first.
About the Author:
John Brewster is a passionate homebrewer with over a decade of experience experimenting with different beer styles. After working at three craft breweries and winning several regional homebrew competitions, John now dedicates his time to developing innovative recipes and teaching brewing techniques. His specialty lies in creating unique flavor profiles by combining traditional brewing methods with unexpected ingredients. When not tending to his five fermenters, John enjoys pairing his creations with artisanal cheeses and hosting tasting sessions for friends and family.